


Global air travel continued to expand in 2025, with premium international passengers reaching 109.7 million, the United States remaining the world’s largest aviation market and Asia-Pacific routes dominating the list of busiest airport connections.
The latest World Air Transport Statistics report from the International Air Transport Association, commonly known as IATA, draws on information from 1,315 airlines. It covers passenger demand, routes, aircraft fleets, airline employment, operating costs and financial performance.
For travelers, the report offers more than a collection of large numbers. It shows where airports are becoming busier, why premium cabins remain commercially important, which aircraft passengers are increasingly likely to fly and where growing demand may affect fares, seat availability and airport congestion.
IATA World Air Transport Statistics 2025: Key numbers
| Aviation measure | 2025 result |
|---|---|
| International premium passengers | 109.7 million |
| Premium passenger growth | 4.5% |
| Premium share of international travelers | 5.5% |
| Largest national passenger market | United States |
| US passenger total | 890.1 million |
| Second-largest market | China |
| China passenger total | 776.1 million |
| World’s busiest airport pair | Jeju–Seoul Gimpo |
| Passengers on busiest route | 13.3 million |
| Most-used aircraft family | Boeing 737 |
| Boeing 737 flights in 2025 | 10.8 million |
The clearest picture is one of strong demand meeting limited capacity. Separate IATA full-year traffic data shows global passenger demand rose 5.3% in 2025, while capacity increased 5.2%. Airlines filled a record 83.6% of available seats across the year.
Why did premium air travel grow in 2025?
International business- and first-class travel grew because corporate journeys, long-haul demand and higher-spending leisure trips remained resilient.
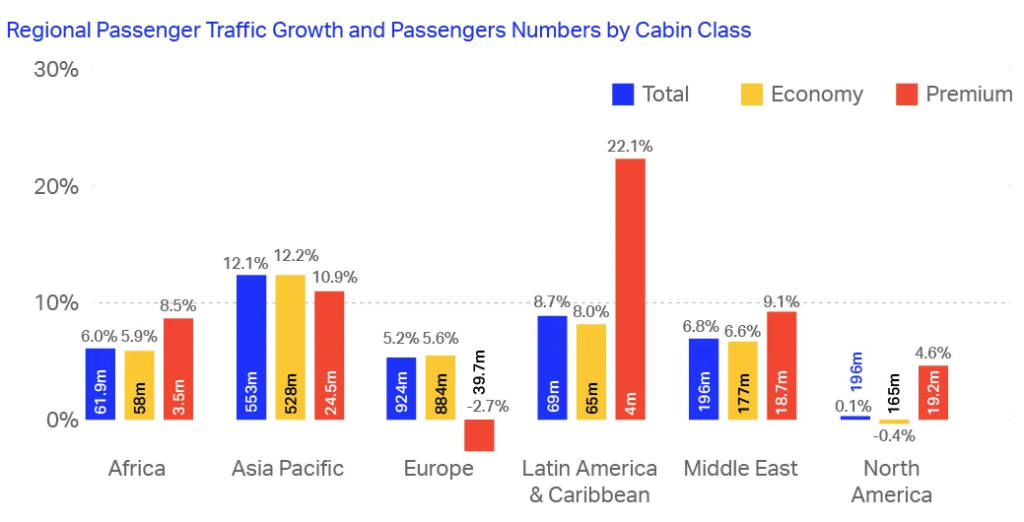
A total of 109.7 million passengers flew internationally in premium cabins during 2025, an increase of 4.5% from the previous year. Premium travelers represented only 5.5% of international passenger numbers, but these seats remain disproportionately important to airline revenue because they sell at much higher prices than economy seats.
Europe remained the largest premium market by volume, recording 39.7 million passengers. Latin America posted the fastest growth, rising 22.1% to four million premium travelers. North America had the highest proportion of passengers using premium cabins, at 10.4%, followed by the Middle East at 9.5%.
What premium growth means for economy passengers
Strong premium demand can influence the entire cabin, including the economy experience.
Airlines may respond by:
- Installing larger premium-economy sections
- Adding business-class seats on profitable long-haul routes
- Reducing the number of standard economy seats
- Offering more paid upgrades before departure
- Increasing lounge and priority-service capacity
- Using newer widebody aircraft on high-value routes
A practical example appears during online check-in. When premium cabins are not full, an airline may send discounted upgrade offers through its app or email. These offers can be significantly cheaper than buying business class at the original booking stage, but the value depends on flight length, seat type and included benefits.
Do not judge an upgrade by the word “business” alone. Check whether the seat lies flat, includes lounge access, earns additional loyalty points or changes the baggage allowance.
Which country had the largest air passenger market in 2025?
The United States remained the world’s largest aviation market with 890.1 million scheduled passengers arriving or departing in 2025.
China ranked second with 776.1 million passengers, while the United Kingdom, Spain and Japan completed the top five. The US grew by 1.6%, the slowest rate among the 10 largest markets, while China increased by 4.8%.
World’s 10 largest passenger markets in 2025
| Rank | Country | Passengers | Annual change |
| 1 | United States | 890.1 million | +1.6% |
| 2 | China | 776.1 million | +4.8% |
| 3 | United Kingdom | 269.7 million | +3.4% |
| 4 | Spain | 252.7 million | +5.0% |
| 5 | Japan | 223.5 million | +9.2% |
| 6 | India | 218.2 million | +3.3% |
| 7 | Italy | 187.3 million | +5.8% |
| 8 | Germany | 163.8 million | +3.4% |
| 9 | France | 152.6 million | +2.2% |
| 10 | Türkiye | 129.3 million | +2.9% |
IATA’s figures count scheduled passengers whose journeys begin or end in each country. Domestic journeys are counted once, while international journeys appear in both the origin and destination markets. This method means the figures should not be read as a count of unique individual travelers.
Why Spain and Japan stand out
Spain’s ranking reflects both strong domestic movement and its position as one of the world’s major tourism destinations, while Japan’s 9.2% growth shows the strength of its travel recovery.
For travelers, fast-growing markets can bring two opposing results:
- More flights and route competition may improve choice.
- More crowded airports and popular travel periods may raise prices and increase delays.
The practical response is to avoid assuming that a large market always provides cheap flights. High demand around school holidays, major events and summer weekends can absorb additional capacity quickly.
Is India still one of the world’s largest aviation markets?
Yes. India ranked sixth globally in IATA’s 2025 country table with 218.2 million scheduled passengers and annual growth of 3.3%.
India’s scale remains significant, but the figure should be interpreted using IATA’s stated method rather than compared casually with airport statistics from another source. Different reports may count passenger journeys, airport movements, domestic travelers and international travelers differently.
For Indian passengers, continued market growth can mean:
- More direct international routes
- Greater competition between full-service and low-cost airlines
- More pressure on airport terminals during holidays
- Expansion of secondary-city connections
- Stronger demand for new aircraft
- Higher fares on routes where capacity fails to match demand
How travelers can handle rapidly growing airports
Use extra time at fast-growing airports, especially during early-morning international departure banks.
A sensible routine is to:
- Complete online check-in before leaving home
- Save a screenshot of the boarding pass
- Confirm the correct terminal
- Prepay baggage when cheaper online
- Keep identification outside checked luggage
- Arrive earlier during holidays and festival periods
- Check whether security or immigration uses pre-registration systems
The most common mistake is relying on a previous journey. An airport that took 25 minutes to cross two years ago may now have a different terminal, a longer security queue or construction affecting access.
Which aviation markets grew fastest in 2025?
Kazakhstan recorded one of the world’s sharpest passenger increases, rising 40% to 18.1 million travelers.
Uzbekistan reached 12.5 million passengers after growth of 16.9%, while Vietnam expanded 14.8% to 80.9 million passengers.
These increases point toward a broader shift in global travel. Central Asia is gaining more international connections, while Vietnam continues to benefit from domestic demand, tourism and expanding regional links.
What fast growth does not automatically mean
Rapid passenger growth does not guarantee smooth travel infrastructure.
A destination can add flights faster than it expands:
- Immigration desks
- Baggage systems
- Airport roads
- Public transport
- Terminal seating
- Air traffic control capacity
- Hotel supply near the airport
Travelers visiting a rapidly expanding market should check recent airport guidance rather than relying entirely on older travel blogs. A new terminal may improve the experience, but incomplete transport links or unclear signage can create new problems during the transition.
What was the world’s busiest flight route in 2025?
Jeju International Airport to Seoul Gimpo remained the busiest airport pair in the world, carrying 13.3 million passengers in 2025.
Asia-Pacific dominated the top 10 busiest airport pairs. Only the Jeddah–Riyadh route was outside the region, and every route in the global top 10 was domestic.
The result explains why some short domestic routes operate with frequencies more commonly associated with buses or trains. On very busy corridors, travelers may find several flights departing within a narrow period.
Busiest airport pairs by region
| Region | Busiest airport pair | 2025 passengers |
| Global | Jeju–Seoul Gimpo | 13.3 million |
| Africa | Cape Town–Johannesburg | 3.4 million |
| Latin America | Bogotá–Medellín | 3.5 million |
| Europe | Barcelona–Palma de Mallorca | 2.1 million |
| North America domestic | New York JFK–Los Angeles | 2.2 million |
| North America international | New York JFK–London Heathrow | 2.1 million |
Stockholm Arlanda–Malmö recorded Europe’s fastest percentage growth, rising 85% to 271,031 passengers.
Does a busy route mean cheaper airfares?
A busy route often offers more flight choices, but it does not guarantee lower fares.
Prices still depend on:
- Number of competing airlines
- Airport charges
- Aircraft capacity
- Business-travel demand
- Holiday periods
- Fuel and operating costs
- Departure time
- How early the passenger books
A route with hourly flights can remain expensive when most seats are filled by business travelers booking close to departure.
The useful comparison is not simply the cheapest ticket. Compare:
| Fare detail | Why it matters |
| Airport location | A cheaper secondary airport may require a costly transfer |
| Checked baggage | Low base fares may exclude it |
| Change rules | A flexible fare may save money later |
| Flight time | Early and late departures may reduce hotel costs or increase them |
| Connection risk | Separate tickets offer weaker protection |
| Seat selection | Families may need to pay to sit together |
Which aircraft flew most often in 2025?
The Boeing 737 remained the most frequently used commercial aircraft family, operating 10.8 million flights in 2025.
The Airbus A320 followed with 8.7 million flights, while the Airbus A321 completed 4.2 million. These narrowbody aircraft dominate short- and medium-haul routes because they allow airlines to match capacity with frequent demand.
Most-used aircraft types in 2025
| Aircraft family | Flights in 2025 | Change since 2019 |
| Boeing 737 | 10.8 million | +3.1% |
| Airbus A320 | 8.7 million | +7.6% |
| Airbus A321 | 4.2 million | +61.6% |
| Embraer E170/E190 | 2.7 million | +2.8% |
| Airbus A319 | 1.4 million | -34.3% |
| Boeing 787 | 795,000 | +40.8% |
| Airbus A220 | 530,000 | +770.4% |
| Airbus A350 | 434,000 | +117.4% |
| Airbus A380 | 90,000 | -24.4% |
The A220 recorded the largest percentage increase from a small 2019 base, while A321 operations grew by more than 60%. The figures reflect airlines’ shift toward efficient aircraft capable of operating both short routes and longer flights that once required widebody jets.
Why are the Airbus A350 and Boeing 787 becoming more common?
Airlines are flying the A350 and Boeing 787 more often because the aircraft are designed for efficient long-haul operations and can support routes that may not fill very large jets.
Compared with 2019, Boeing 787 flights increased 40.8%, while A350 flights rose 117.4%. Airbus A380 operations remained 24.4% below their 2019 level.
This does not mean the A380 is disappearing immediately. It remains valuable on heavily constrained routes where airlines need to move many passengers through limited airport slots. However, the broader trend favors flexible twin-engine aircraft.
What aircraft type means for passenger comfort
Aircraft model alone does not determine whether a flight will feel comfortable.
Cabin experience also depends on:
- Airline seat layout
- Seat width and pitch
- Age of the interior
- Cabin humidity
- Noise level
- Window design
- Entertainment system
- Number of toilets
- Whether the airline uses nine or 10 seats per row
A Boeing 787 operated by one airline can feel noticeably different from the same aircraft flown by another. Before booking a long flight, check the exact airline layout and avoid relying only on promotional descriptions of the aircraft.
Why were airline seats so full in 2025?
Airlines filled a record share of seats because passenger demand grew slightly faster than available capacity.
IATA’s separate full-year market analysis reported demand growth of 5.3%, capacity growth of 5.2% and a record annual passenger load factor of 83.6%. International demand grew 7.1%, while domestic demand increased 2.4%.
A higher load factor helps airlines earn more from each flight, but passengers experience the result as:
- Fewer empty middle seats
- Less cabin storage space
- Longer boarding times
- More difficulty changing flights during disruptions
- Higher last-minute prices
- Greater competition for preferred seats
How to protect yourself when flights are nearly full
Prepare for a full cabin even when the seat map looks open several days before departure.
Airlines may not display every assigned seat, and travelers can be allocated seats during check-in.
Use these steps:
- Select an acceptable seat before departure when the price is reasonable.
- Keep medication and one day of essentials in cabin baggage.
- Follow carry-on size and weight limits.
- Arrive before boarding begins when overhead space matters.
- Avoid extremely tight self-made connections.
- Save airline contact details offline.
- Know whether your ticket permits same-day changes.
When a flight is canceled on a route with 90% of seats already occupied, moving hundreds of travelers to later services becomes much harder.
Does the IATA report mean airfares will rise?
The WATS data does not directly predict individual ticket prices, but high demand and heavily filled flights reduce the pressure on airlines to discount seats.
Fares can still fall when airlines:
- Add new capacity
- Launch a new route
- Enter a competitive market
- Run seasonal promotions
- Use larger aircraft
- Need to stimulate travel in quieter months
Travelers should not interpret annual statistics as a reason to book any fare immediately. The better approach is to track the specific route, compare complete trip costs and understand the normal seasonal price range.
A practical airfare-checking method
Compare the same trip across three different date combinations before booking.
Check:
- Original preferred dates
- Departure one day earlier
- Return one day later
- Nearby airports
- Direct flight versus one connection
- Fare with baggage included
- Refundable or changeable fare
Moving one date can sometimes save more than choosing a complicated itinerary with separate tickets.
What the 2025 aviation statistics reveal about future travel
The aviation market is becoming larger, more concentrated on high-demand routes and increasingly dependent on efficient narrowbody and twin-engine long-haul aircraft.
The strongest signals are:
- Premium international travel remains commercially powerful.
- Asia-Pacific dominates the busiest domestic routes.
- The United States and China remain far ahead in market size.
- Central Asia and Vietnam are expanding rapidly.
- Airlines are using more A321s, A220s, A350s and Boeing 787s.
- Global flights are operating with historically high seat occupancy.
For travelers, these trends favor flexibility. There may be more routes and more modern aircraft, but fuller cabins make disruption recovery harder. The person who books a sensible connection, understands baggage rules and arrives prepared will have a much smoother experience than someone relying on spare seats and last-minute fixes.
Frequently asked questions about IATA’s 2025 air transport statistics
What is the IATA World Air Transport Statistics report?
World Air Transport Statistics is IATA’s annual collection of airline data covering demand, capacity, routes, fleets, employment, costs and revenues. The 2025 edition includes information from 1,315 airlines.
Which country had the most air passengers in 2025?
The United States was the largest passenger market with 890.1 million scheduled passengers arriving or departing. China ranked second with 776.1 million.
What was the world’s busiest air route in 2025?
Jeju–Seoul Gimpo was the busiest airport pair, carrying 13.3 million passengers.
How many people flew in business or first class in 2025?
International premium cabins carried 109.7 million passengers, up 4.5% from 2024.
Which aircraft operated the most flights?
The Boeing 737 family operated 10.8 million flights, followed by the Airbus A320 with 8.7 million.
Is the Airbus A380 becoming less common?
A380 flight activity remained 24.4% below its 2019 level, while the Boeing 787 and Airbus A350 operated significantly more flights than in 2019.
Which passenger markets grew fastest?
Kazakhstan grew 40%, Uzbekistan increased 16.9% and Vietnam expanded 14.8% in 2025.
Were planes fuller in 2025?
Yes. The global passenger load factor reached a full-year record of 83.6%.